Debugging blazor applications is a little different from what we’ve been doing for years for debugging the JS files.
Microsoft team announced official preview of Blazor framework recently. I wanted to try the new Blazor framework so I’ve installed VS 2019 preview.
I ran the blazor application by following the setup instructions mentioned on Microsoft docs.
After running the application, I just opened the developer tools in chrome to debug the Counter function that came up with default blazor template. Unfortunately, I couldn’t see any of the counter files.
And I saw the following console message
Debugging hotkey: Shift+Alt+D (when application has focus)
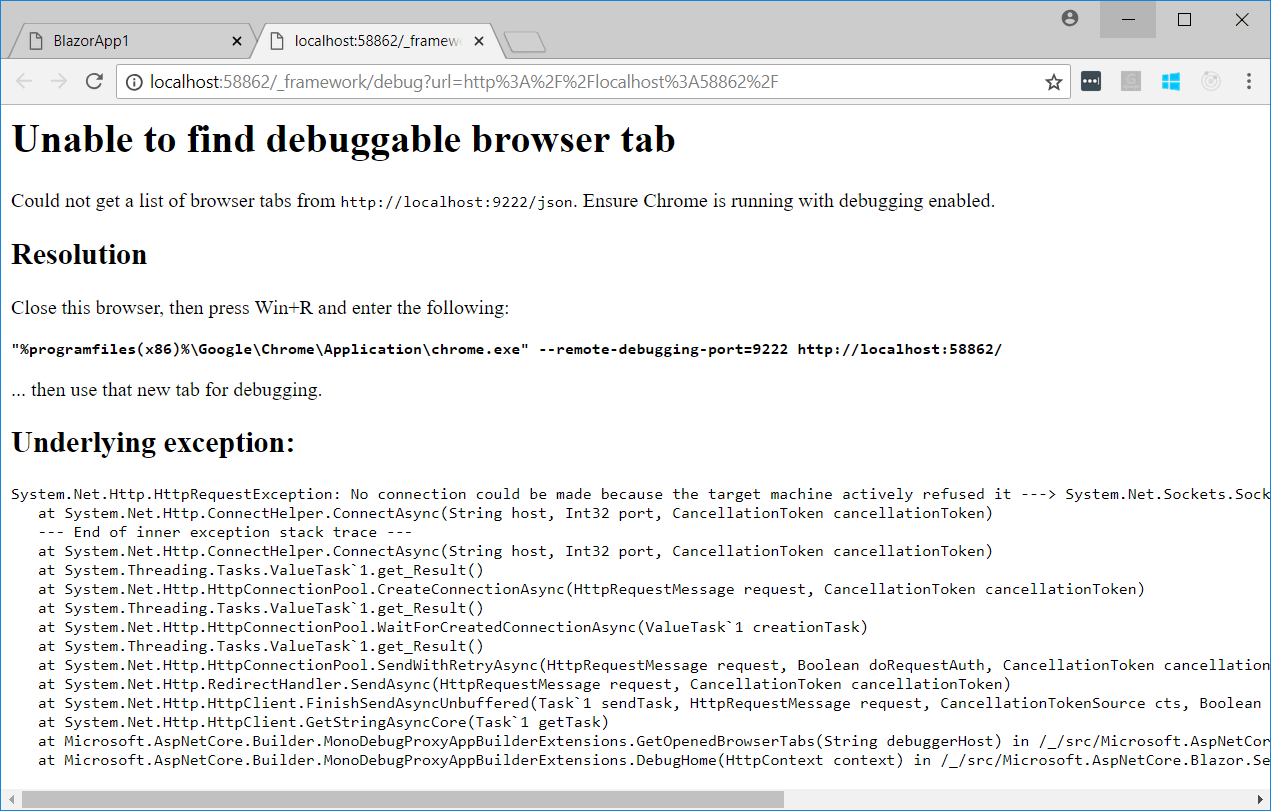
I press that hot key and I have the new tab opened in chrome with the following error message.

Although, there is a resolution mentioned in the above screenshot it will not work.
Solution
close all the instances of chrome browser.
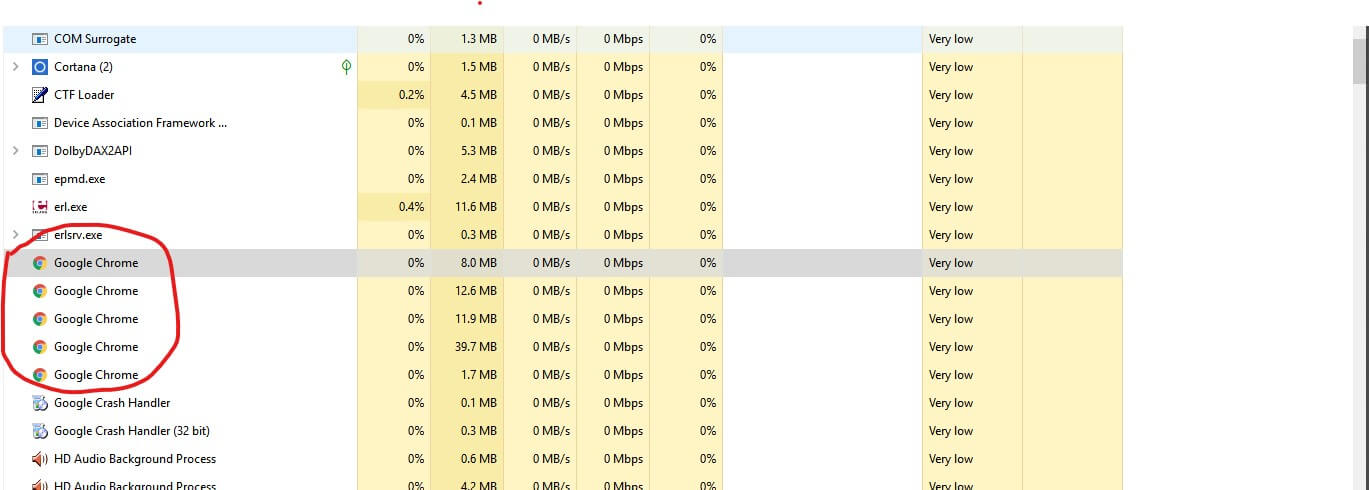
Once you close your browser window, make sure you also end the tasks of chrome.exe process from Task Manager.
The following are the google chrome processes which are still alive though you close google chrome.

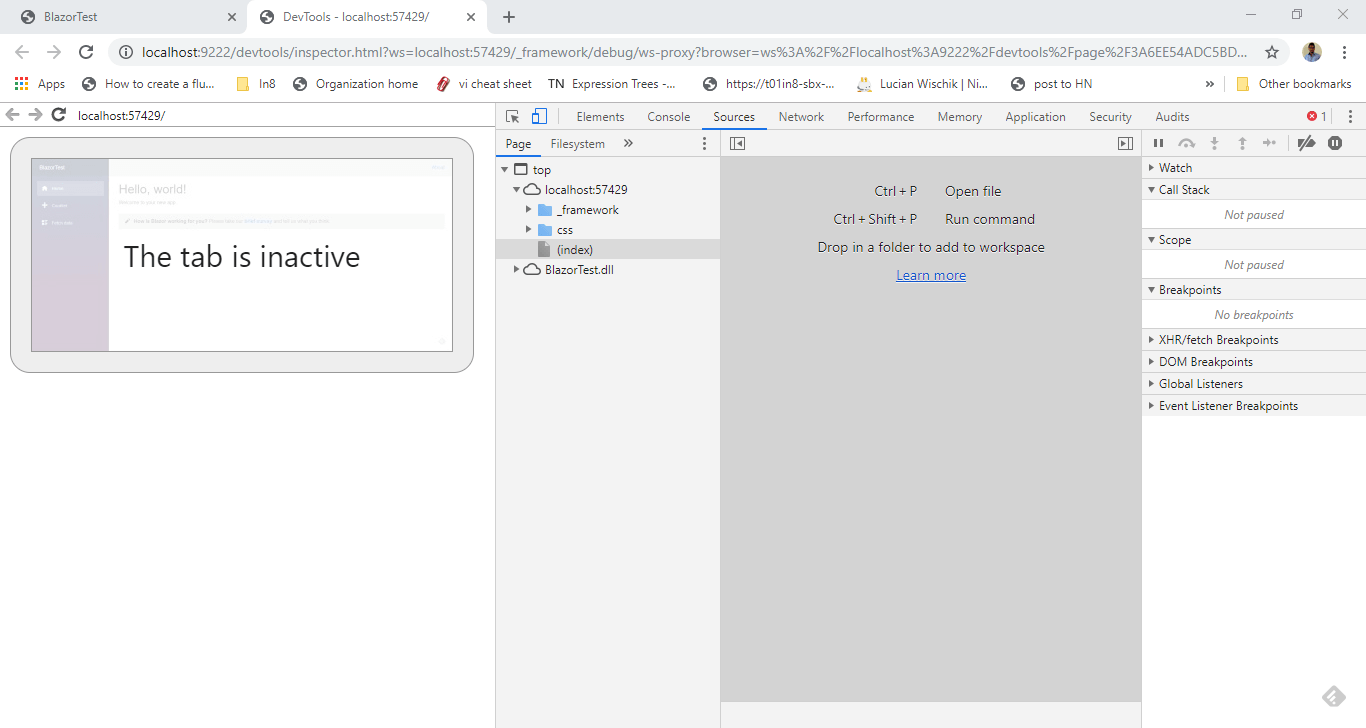
Once you close all the instances of chrome, run the app again and press Shift + Alt + D with the focus on application. And here is the debugging window.

That’s it for debugging.
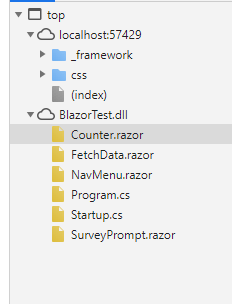
Where’s the Counter.razor file?
It’s in yourapp.dll folder in the sources >> Page folder.

Pic Credits
- Featured Photo by Sebastian Herrmann on Unsplash


