When I wanted to look at the IL of the C# code I wrote I used to create a new console application in visual studio and write the code and build it and view the DLL with ILSpy or dotPeek.
These days I’m using LINQPad to view the IL quickly.
Here is the alternative to that hectic setup, Sharplab.
SharpLab is developed by Andrey Shchekin. SharpLab is a similar tool you can use to Run, De-compile (C#, IL, JIT Asm) and visualizing syntax trees. You can also switch the C# language to whatever you want in SharpLab.
And the good thing about SharpLab is that you don’t need any tools except a web browser.
Visualizing stack/heap and boxing
Apart from viewing IL or viewing de-compiled C# code. SharpLab recently added a new feature to visualize .NET stack/heap and boxing.
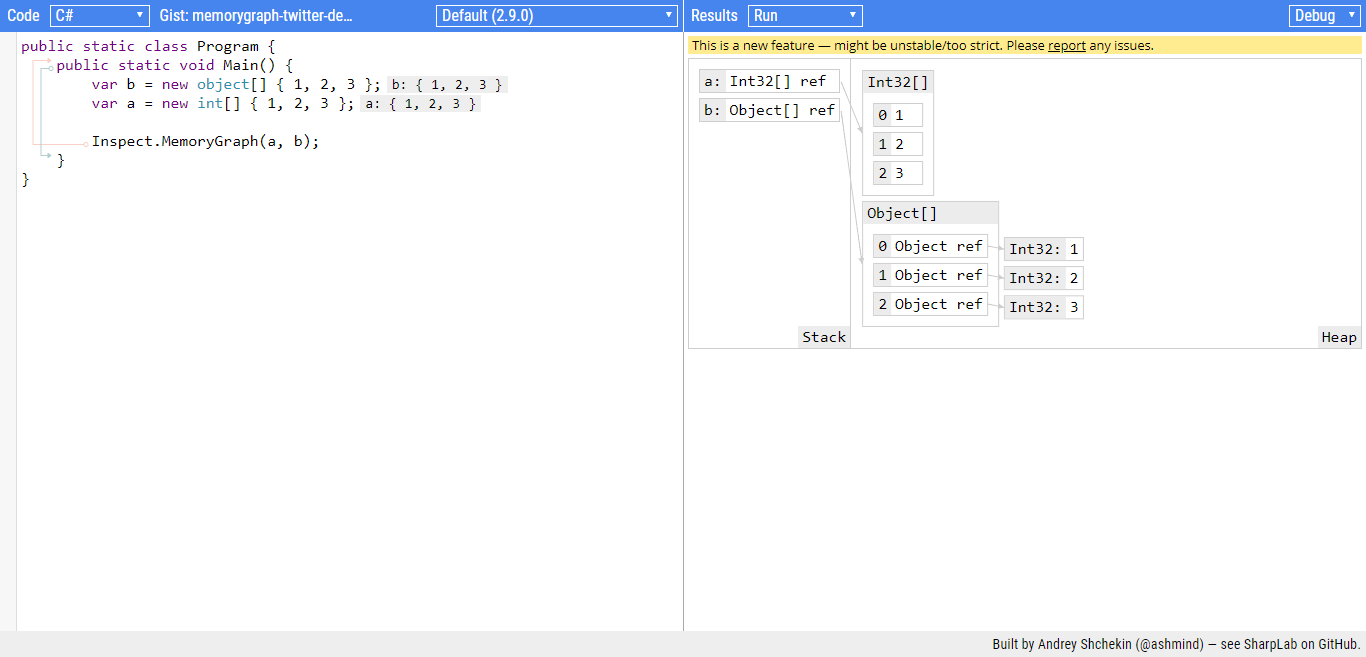
Once done with writing or creating an object, you could just use Inspect.MemoryGraph(obj) statement to see if it is on stack/heap. You can also see the boxing happened on the objects.
This is how it looks like.

Viewing structure of object in Memory (heap)
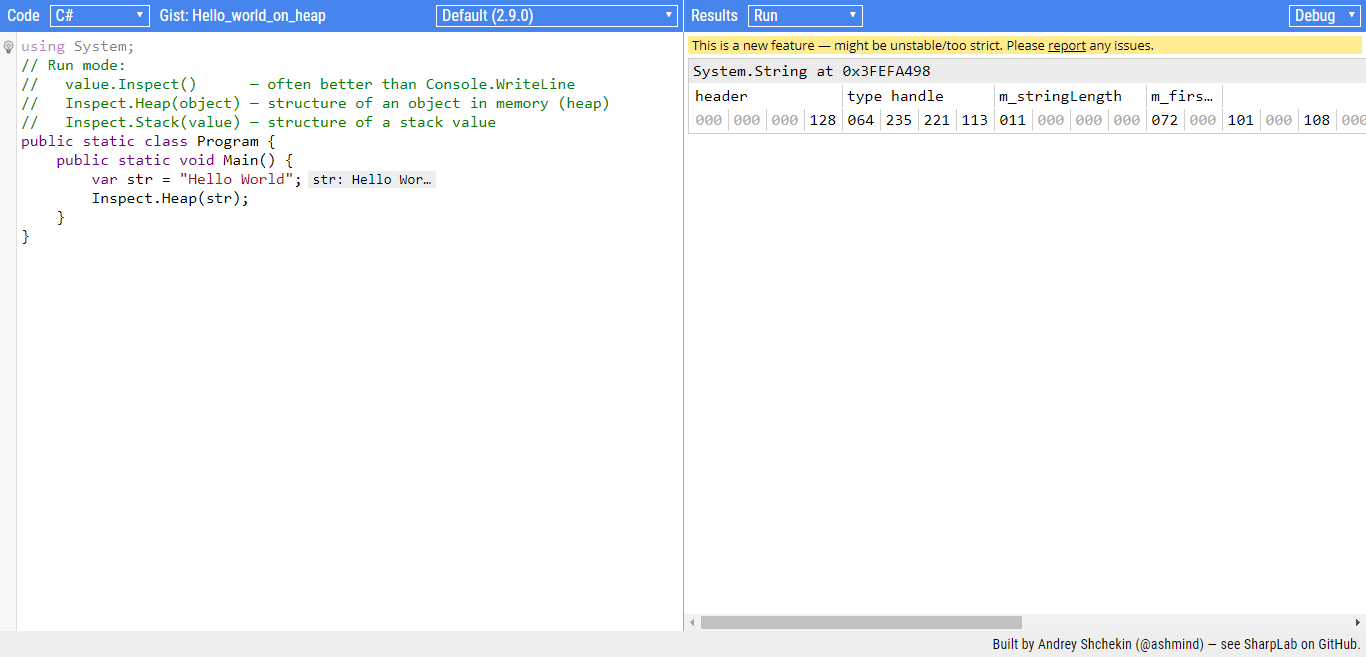
If you want to view the structure of an object in the memory, you can use Inspect.Heap(object) statement.
Let’s inspect a string value in the memory and here it is.

Viewing structure of stack value
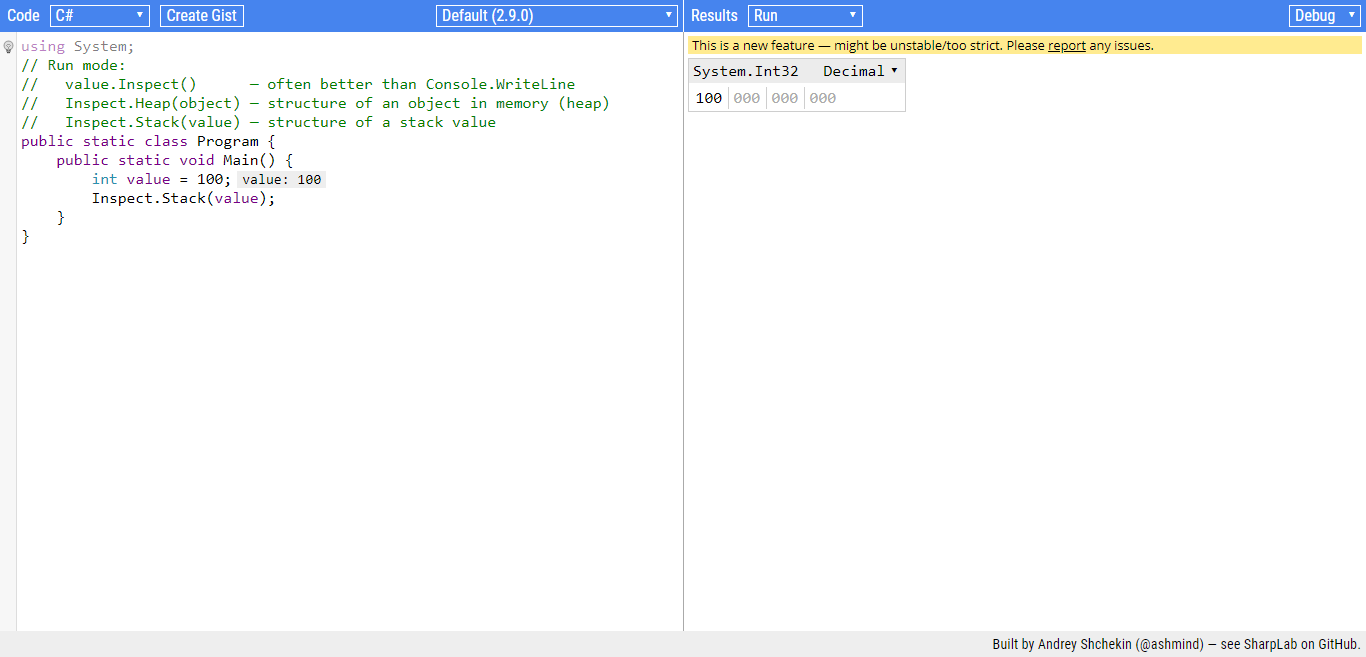
You can view structure of any stack value with Inspect.Stack(value) statement.
Lets view a value structure on stack

value.Inspect()
This is an alternative to write Console.WriteLine to view a value in the output window in SharpLab. Try it out.


